Aurora Activity
Space weather data for aurora chasers
Aurora Score
No location selected
Go to the Map tab to search or pick a location. All local data (weather, sun/moon, aurora score) will update automatically.
Aurora Visibility
Pick a location to see your visibility
Space Weather Charts
Indicative demo data. Live data coming soon
Kp Index History
Planetary K-index · 3-hour windows · Storm at Kp 5
Unavailable
Solar Wind Speed
Activity threshold at 400 km/s
Unavailable
IMF Bz / Bt
nT · Southward Bz favours aurora
Unavailable
Solar Wind Density
Protons/cm³
Unavailable
Dst Index
How strong the storm's ring current is around Earth. The more negative, the stronger the storm: below −50 nT is a moderate storm, below −100 an intense one. Dst reacts later than Kp and stays low while a storm recovers. Hourly, provisional.
Dst trend
Unavailable
Bands: −30 weak · −50 moderate · −100 intense · −250 extreme. Kyoto's real-time (provisional) Dst from the WDC for Geomagnetism, Kyoto, via NOAA SWPC.
OVATION Aurora Model
NOAA's short-term aurora forecast model. Hemispheric Power is the total energy deposited into each polar region by incoming particles. Values above ~50 GW go with bright aurora that can be seen from mid-latitudes. Updates every 5 minutes from the OVATION-Prime model.
Hemispheric Power trend
Unavailable
Sudden jumps between adjacent points are genuine OVATION model run updates, not data errors.
Sun at a glance
F10.7 Radio Flux
The solar radio flux at 10.7 cm, a reliable daily measure of the Sun's overall activity that closely tracks sunspot number and UV output. Measured from the ground at Penticton, Canada.
Flux trend
45 daysUnavailable
Typical range ~50–300 s.f.u. across a solar cycle. Higher means a more active Sun.
Sunspot Regions
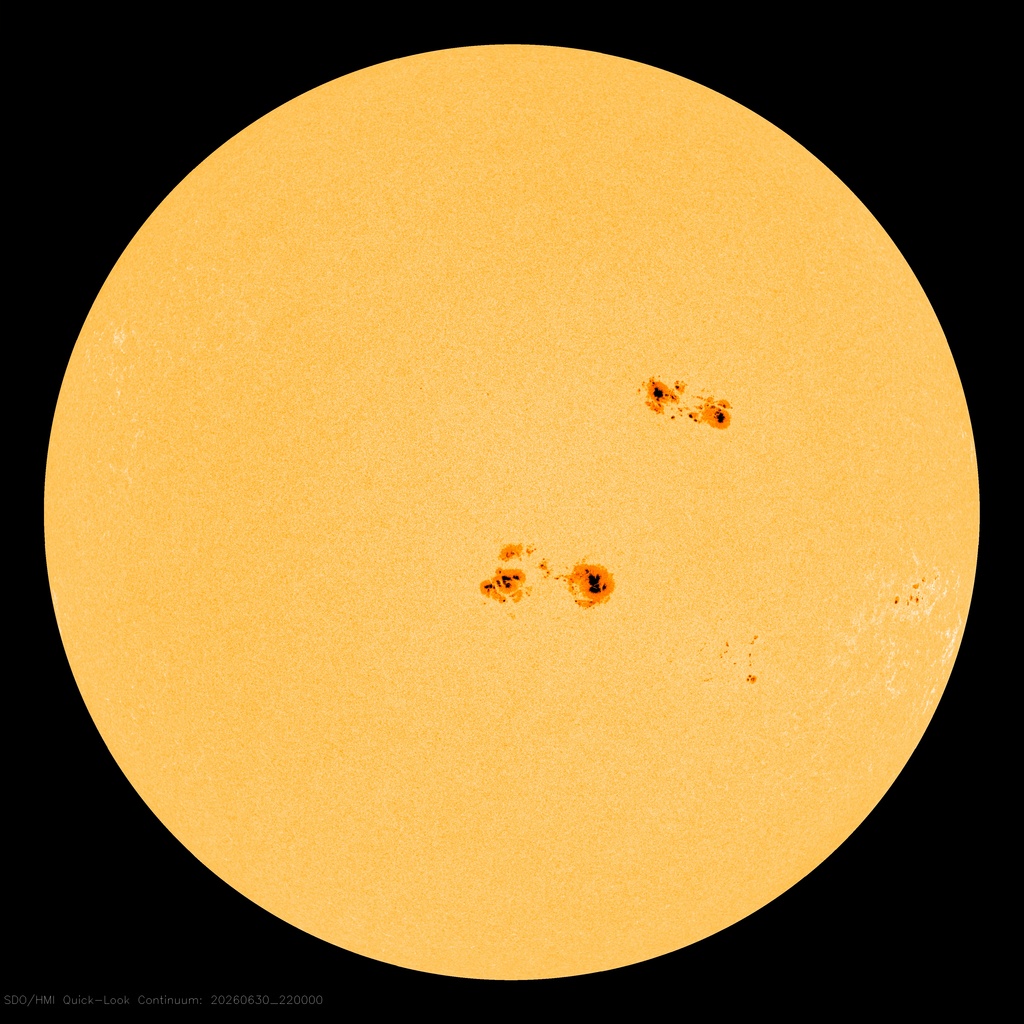
SDO · HMI intensitygram (flattened). Dark spots are the sunspot regions listed here.
Active regions on the Sun's surface, the sources of flares and CMEs. Larger, magnetically complex regions (β-γ-δ) are the most likely to erupt. Updated daily by NOAA SWPC.
Unavailable
Active regions on the Sun's surface, the sources of flares and CMEs. Larger, magnetically complex regions (β-γ-δ) are the most likely to erupt. Updated daily by NOAA SWPC.
Unavailable
SDO · HMI intensitygram (flattened). Dark spots are the sunspot regions listed here.
Solar Imagery
Real-time views of the Sun across different wavelengths and instruments. Each channel reveals a different layer of solar activity.
SDO · AIA 193 Å
1.25 MK corona. Dark regions are coronal holes, openings in the Sun's magnetic field where high-speed solar wind escapes. A hole facing Earth can drive geomagnetic activity, and aurora, 2 to 4 days later.
Coronagraph Views
Coronagraphs block out the bright solar disk to reveal the faint corona around it. This is where coronal mass ejections (CMEs) are first seen heading into space.
SOHO · LASCO C3
Courtesy of SOHO/LASCO consortium. SOHO is a project of international cooperation between ESA and NASA.
SOHO outer coronagraph (3.7 to 30 solar radii). The wider field follows CMEs further out. Planets and bright stars regularly cross the field of view.
GOES Radiation
GOES-18 satellite measurements of X-ray flux from the Sun and energetic protons reaching Earth. Strong X-ray flares can disturb the ionosphere within minutes. Proton storms can degrade GPS and pose a radiation risk above 60° latitude.
X-ray flux, last 24h
24h · 0.1–0.8 nmUnavailable
Y-axis steps mark flare class boundaries (A → X). Each step represents a 10× increase in flux.
Recent flares, last 24h
Unavailable
Coronal Mass Ejections
Coronal mass ejections (CMEs) are massive eruptions of plasma and magnetic field from the Sun's corona. Earth-directed CMEs can drive significant geomagnetic storms 1 to 4 days after launch.
WSA-ENLIL Solar Wind Prediction
A physics-based 1–4 day forecast of solar-wind structures and Earth-directed CMEs. Top row: density. Bottom row: radial velocity.
Left: ecliptic (overhead) view · Middle: slice through Earth · Right: time series at Earth and STEREO-A.
Tonight
Calculated locally…
Weather now
No location selected. Pick a location on the map for local data.